Oxford, UK v. Atlanta, USA (Round 1)

The link to my Jupyter Notebook with the accompanying coding for this data analysis project is available below:
A Tale of Two Cities: Battle of the Neighborhoods Capstone Project Jupyter Notebook
Introduction
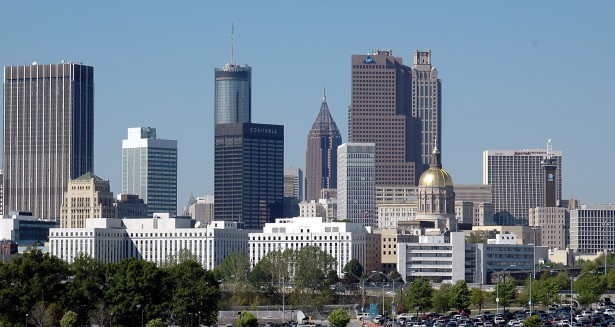
Oxford is a city in central southern England with a population size of around 155,000 people. The city is known for its University, which was established in the 12th century, but is also a hub for manufacturing, publishing and science based industries and research, as well as education and tourism. Atlanta is the capitol of the US state of Georgia and is the most populous city in the state with an estimated 498,044 residents. Atlanta is a culturally and economically diverse city with dominant economic sectors including aerospace, transportation, professional and business services, media and medical operations, and information technology.
The aim of this project is to explore the neighborhoods in both cities and group them by common nearby venues. This will assist anyone visiting or relocating between the cities to consider which areas are most similar to their current neighborhood and therefore might offer their preferred range of amenities. This information is very useful when moving to an unknown city and will help narrow down the list of areas to search for a new home, thus speeding up the relocation process and avoiding overly long and potentially pricey stays in hotels or other temporary living arrangements. Alternatively for those visiting between the cities, this information could be useful in deciding the best location for a vacation rental or hotel booking, based on the interests and priorities of the traveler(s).
Data
The following data sources were used to complete this project:
- Oxford postcode data from Doogal.co.uk updated 2020
- Atlanta zip code and neighborhood data from local real estate company (The Keen Team) 2020
- Cross referenced Atlanta zip code and neighborhood data from US Map Guide 2020
- US Longitude and Latitude data by zip code from Open Data Soft.com 2020
- Foursquare API
Oxford, UK Neighborhood Data Sourcing and Cleaning
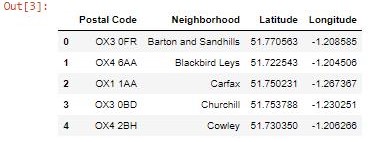
The data set (1) for Oxford was the most complete and included postal code data, ward (neighborhood) names, and the corresponding latitude and longitude coordinates for all OX postcodes, which covers the entire county of Oxfordshire. The data was in the form of a downloadable excel spreadsheet, which I then cleaned and formatted to include only Oxford city postcodes, ward (neighborhood) names and map coordinates. Finally, I reduced the list of wards by removing duplicate values so that there would only be one occurrence of each neighborhood and corresponding data.
It should be noted that this method randomly dropped duplicates so the remaining full postal codes corresponding to each neighborhood were one of many possible options. Different post code choices would have had slightly differing latitude and longitude coordinates. This may have affected the resulting venue data sourced from Foursquare and skewed the results. I then uploaded this data set to my Jupyter notebook and used the <insert to code> function to transform it into a pandas data frame.
Atlanta, USA Neighborhood Data Sourcing and Cleaning
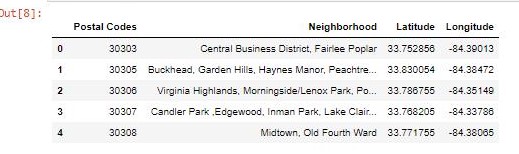
The data sets (2)(3) used to source a list of Atlanta neighborhoods and corresponding postal codes (zip codes) were simply lists from an Atlanta real estate website and a US map guide website respectively. I manually copied and input this data into an excel spreadsheet and added any differences between the data (missing or additional neighborhoods or zip codes) to ensure a more complete breakdown. Unfortunately data available from local city government sources was not in the required format so I could not use more authoritative sources. Therefore the breakdown of neighborhoods to zip codes in this data set should be taken as advisory only and may differ between data sets.
Initially I was going to use Geopy Nominatum to find the map coordinates for each zip code. However the results were wildly inaccurate. As an alternative I found and downloaded a spreadsheet of all US zip codes and corresponding latitude and longitude coordinates (4) from the Open Soft Data website. I manually filtered this excel spreadsheet to list only Atlanta zip codes and map coordinates. I uploaded both excel sheets to my Jupyter notebook using the <insert to code> function to transform them into Pandas data frames, dropping any unnecessary columns. Finally, I combined the separate Atlanta data sets using a Pandas join function on the common column value of zip codes.
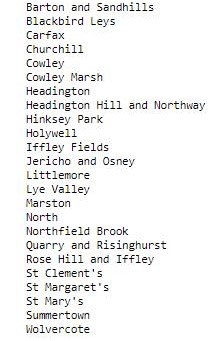
The resulting dataset for Oxford had 24 neighborhoods and the dataset for Atlanta had 28 neighborhoods.

Final List of Neighborhoods Used for this Project
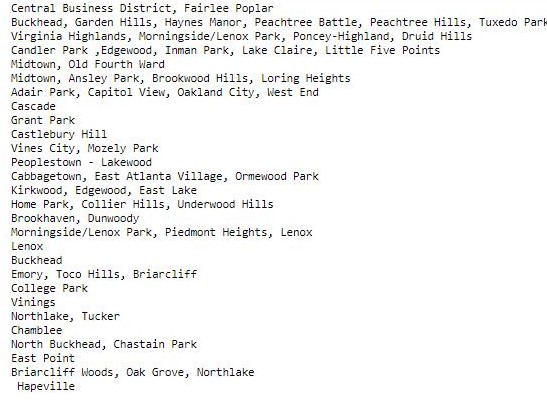
Methodology
Before sourcing the venue data, I completed initial visual analysis of the neighborhood data for both cities to view the layout of the neighborhoods on a map. This was to ensure the coordinates were initially generally correct and to see the spread of the neighborhoods across each city, as they vary significantly in geographical size.
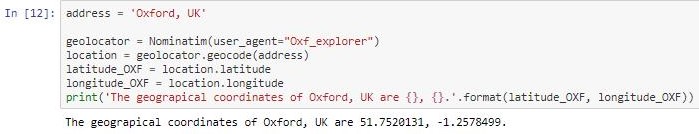
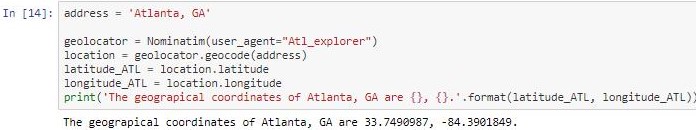
Using the Nominatum tool in Geopy, I calculated the latitude and longitude coordinates of both cities.
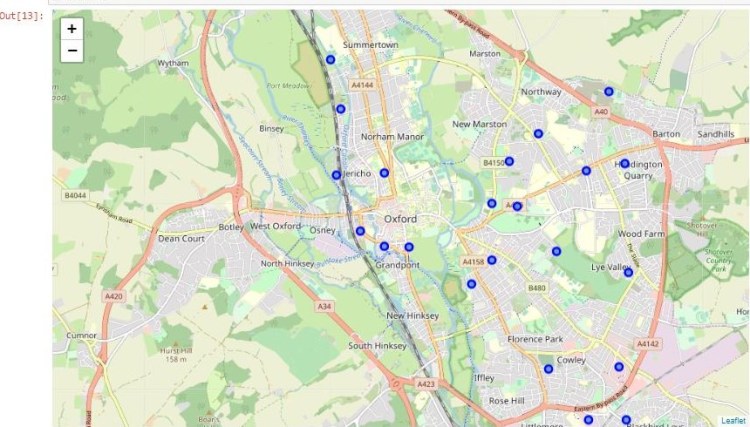
I then used Folium to create maps of the two cities using the above generated coordinates. Finally, I was able to code markers onto each city map of the corresponding neighborhood coordinates using the data from the previously created data frames.
Oxford, UK Neighborhoods Map
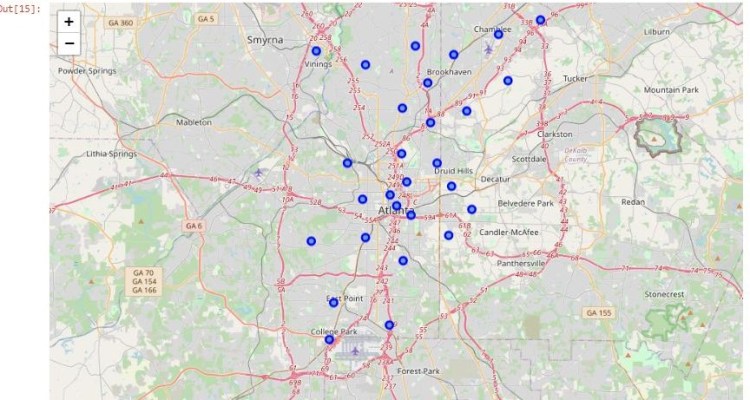
Atlanta, USA Neighborhoods Map
Foursquare API: Venue Data
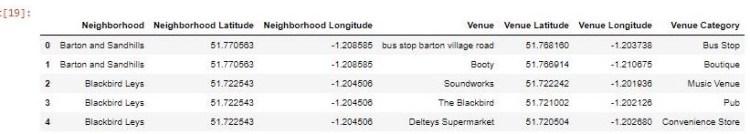
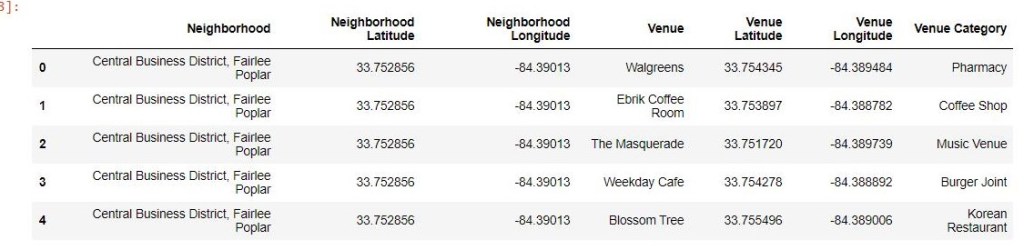
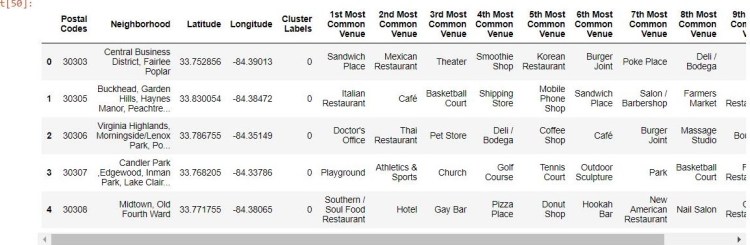
Using Foursquare, I was able to generate a list of venues by category in each neighborhood based on the corresponding map coordinates in the data sets for both cities. I set the radius to 500 and limited the venue results to 100 per neighborhood or set of coordinates. I then transformed this venue data into Pandas data frames (see below example of Oxford neighborhood venue data generated using Foursquare API.) The process was repeated for Atlanta neighborhoods.
Finally, I created a new data frame for each city listing the top 10 most common venues in each neighborhood based on frequency.
Oxford Top 10 Venues by Neighborhood
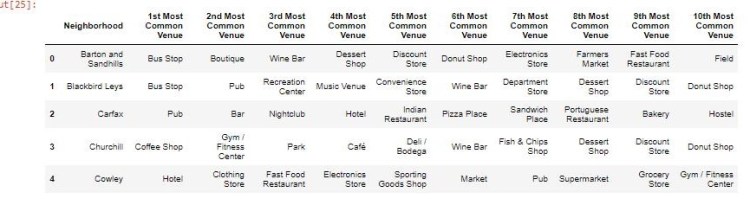
Atlanta Top 10 Venues by Neighborhood
Finding the best K for K-Means Clustering
K-Means is one of the most common methods of unsupervised machine learning for clustering. Using one hot encoding and mean frequency on the new data frames, I was able to then apply algorithms from the SciKit Learn library to calculate the best K value for K-means clustering of the neighborhoods in each city. I initially used the Silhouette method but the results were inconclusive. I therefore tried the Elbow method (sum of squared distances) and achieved slightly better results in both cases. I used Matplotlib to plot the results.
Finding K for Oxford Clustering
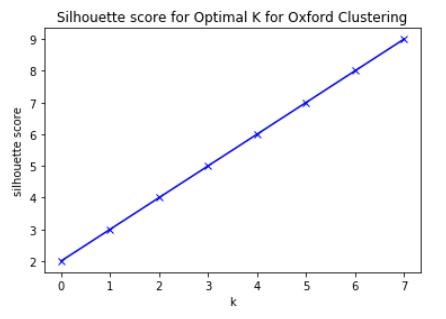
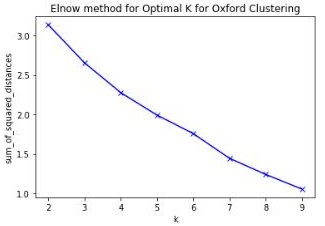
I determined the best K would be either 5 or 6 for the Oxford venue data. However after implementing both, it was clear the neighborhood clustering stopped at 5.
Finding K for Atlanta Clustering
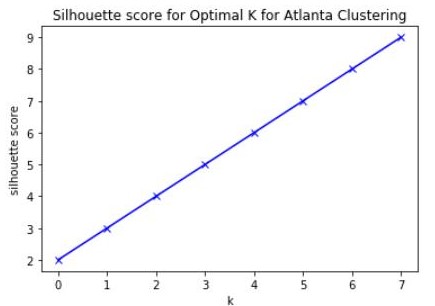
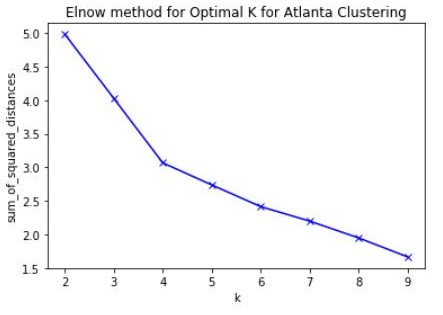
I determined the best K could be 4 for the Atlanta venue data. However I felt that was a bit low for clustering 28 neighborhoods and wanted there to be at least as many clusters in Atlanta as in Oxford. I implemented clustering using 5 and 6 and ultimately choose 6 as a good option for K in this case.
K-Means Clustering Neighborhoods
Using the K-means algorithm, I clustered the neighborhoods in both cities and merged this data with the Top 10 Venue data frames. I also cleaned the data to ensure the clusters were integers and not floats, as otherwise they would not show up properly on the maps using Folium.
Oxford Clustered Neighborhoods Pandas Data frame
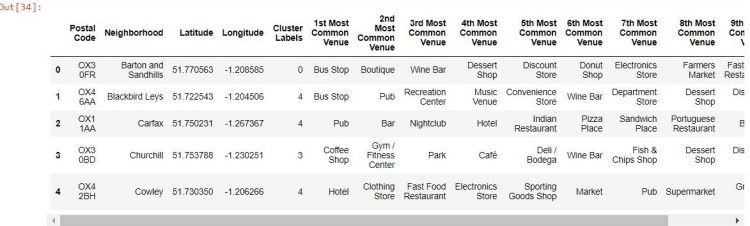
Atlanta Clustered Neighborhoods Pandas Data frame
Results and Discussion
Mapping the Neighborhoods by Clusters
Using Folium once again and the new data frame including the top 10 venues in each neighborhood and the Cluster labels, I mapped out the neighborhoods in both cities. The neighborhoods are color coded by cluster to show the cluster groupings visually.
Map of Oxford Neighborhoods (Color Coded by Cluster)
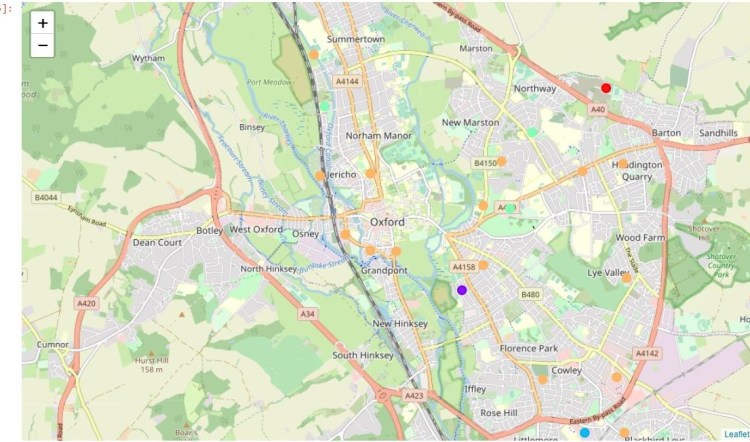
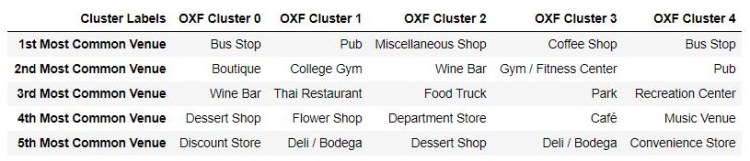
Labelling and Initial Analysis by Cluster: Oxford
Cluster 4 (Orange): Pubs, Shopping Mall, Restaurants, Museums and Bars
This cluster is the largest by a significant margin and includes 17 of the 24 Oxford Neighborhoods. This could be due to a number of factors including the range of venue types returned by Foursquare. As mentioned in the data section of this report, the venue list generated relies on the latitude and longitude coordinates provided for each neighborhood. If these coordinates are not the optimal choice then the venue data may be inaccurate and this could have skewed the cluster results.
Cluster 3 (Light Green): Cafes and Parks
This cluster is the second largest with 3 neighborhoods.
Cluster 2 (Light Blue): Small Shops and Food
Cluster 1 (Purple): Pubs and Gyms
Cluster 0 (Red): Bus Transport, Boutiques and Food
The remaining clusters were assigned one neighborhood each. It may be that these areas did not have enough venues to properly cluster them or there were very distinctive venues. However looking at the top three venues listed for clusters 0, 1 and 2, this does not seem likely. It is also possible they are heavily residential or zoned for business.
Map of Atlanta Neighborhoods (Color Coded by Cluster)
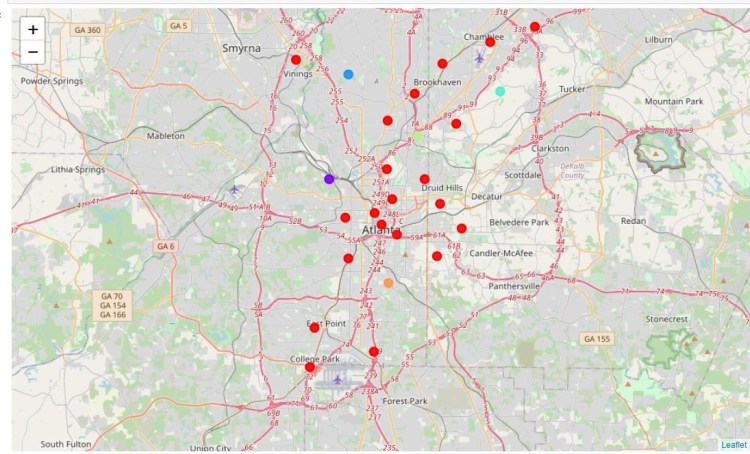
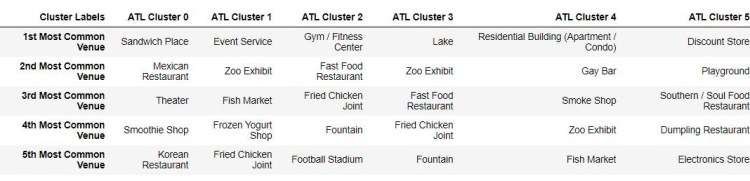
Labelling and Initial Analysis by Cluster: Atlanta
Cluster 0 (Red): Restaurants, Businesses, Tourist Attractions, Hotels, Breweries, Music Venues, Bars
This is by far the largest cluster of neighborhoods and we can see that neighborhoods across all areas of Atlanta have been included in this group. 21 of the 28 neighborhoods in Atlanta have been assigned to this cluster. As with cluster 4 from the Oxford data, it may be that the neighborhoods in this cluster have too wide a range of venue results to be very useful as a measure of similarity. Clustering based on other data or a subsection of the venue data could be required to better categorize these neighborhoods and break them down into smaller and more distinct clusters. It may also be that the radius needs to be changed when generating the venue lists from Foursquare.
Cluster 1 (Purple): Event Venues, Zoo Exhibits, and Fish Market
Cluster 2 (Light Blue): Gyms, Fast Food and Sports Stadiums
Cluster 3 (Teal): Nature/Parks, Zoo and Fast Food
Cluster 4 (Lime green): Residential Apartments, Gay Bars, and Smoke shops
Cluster 5 (Orange): Discount shops, Playgrounds and Southern/Soul Food Restaurants
The remaining clusters have only one neighborhood each. Again this may be due to inaccurate or incomplete venue data or it may be the result of better clustering than the above Cluster 0.
Comparing Neighborhood Clusters Between Cities
For both cities we see a similar results pattern in the clustering of neighborhoods. Both have returned one cluster comprising the majority of the neighborhoods, with the remaining clusters generally having one neighborhood each. The most similar clusters between the two cities are these large clusters, Cluster 0 in Atlanta and Cluster 4 in Oxford. However it is clear that more clustering analysis on the basis of other data beyond nearby venues will be required to more accurately group similar neighborhoods in each city. Even if this is accomplished, the results may still show that there are many neighborhood clusters that do not have direct comparison between these two cities. This could be due to a number of factors, such as the geographical size and layout of the neighborhoods and differences in culture and lifestyle between the US and the UK. Further analysis and investigation is required.
It may also be necessary to better clean the venue data returned by Foursquare API. As we can see below, some of the top venues listed and used in the clustering analysis include uninformative categories such as ‘Bus Stop’ or ‘Miscellaneous Shop’ or ‘Discount Store’. This may or may not be a significant venue and could be excluded for more statistically significant venues. This is something to consider if this project were to be replicated.
Top Five Venues in each Cluster: Oxford and Atlanta
Conclusions
This project has given us some insight into the amenities in the selected neighborhoods in both Oxford and Atlanta, which partially fulfills the intended purpose of the exercise. The information garnered provides a useful, albeit cursory and broad, snapshot of each neighborhood. However based on the results it is clear we need more holistic data to improve the accuracy and usefulness of our neighborhood clustering. If I were to redo this project, I would consider including data on population, cost of living, demographics, schools and transportation. I would also better clean the venue data and ensure that the best map coordinates were being used to represent each neighborhood in order to improve the accuracy of venue results. Finally, I would consider whether factors such as culture or geographical size and spread are impacting the results and how these could be minimized to better standardize the data and subsequent results to ensure more accurate comparison.
Thank you for reading! This project was created for my Coursera capstone course to complete my IBM Professional Certificate in Data Science.
To view the pdf version of this project report please see below:
